AI Models
OpenRouter Market Share Odds 2026: DeepSeek at 96.5%
Polymarket now prices AI lab usage share on OpenRouter. DeepSeek is 96.5% for the week of 19 October while the arena markets crown Google and Anthropic.

Key takeaways
- Polymarket opened three markets on 19 October 2026 that rank AI labs by their share of tokens routed through OpenRouter. DeepSeek is priced 96.55% to finish the week of 19 to 25 October in first place. Anthropic, which holds three of the top eight entries on the intelligence index published on the same OpenRouter page, is priced 0.55%.
- The two arena-rank markets carry $5,846,767 of lifetime volume against $48,696 on the three OpenRouter rank markets, a ratio of 120 to 1. The board with the money asks which lab wins a blind preference vote; the board with almost none asks which lab gets used.
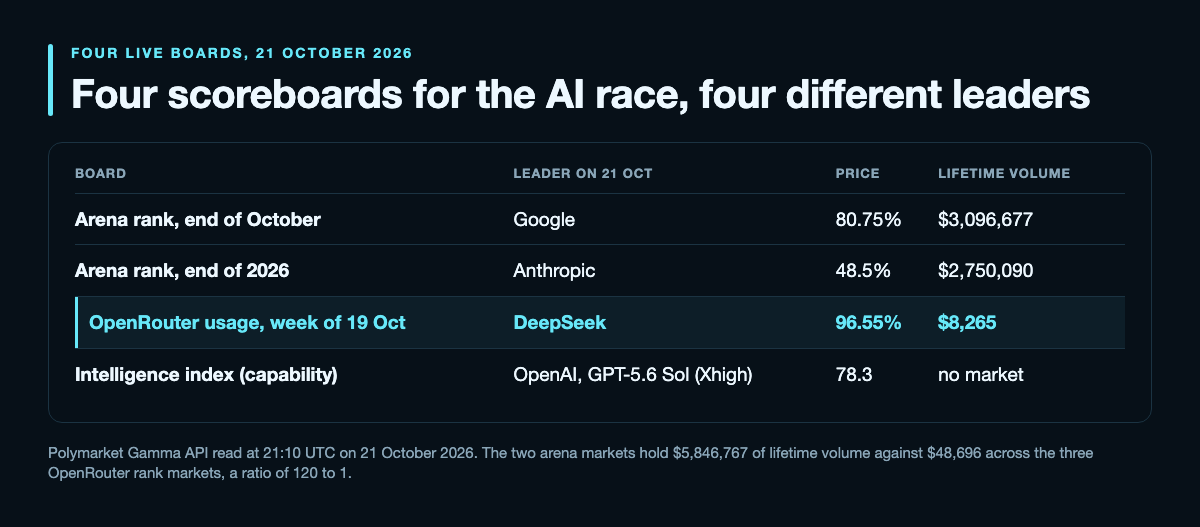
- Four live boards name four different leaders. Google is 80.75% on arena rank at the end of October, Anthropic is 48.5% on arena rank at the end of 2026, DeepSeek is 96.55% on OpenRouter usage, and OpenAI holds the top two intelligence-index entries at 78.3 and 77.1 while trading at 0.55% on the October arena market.
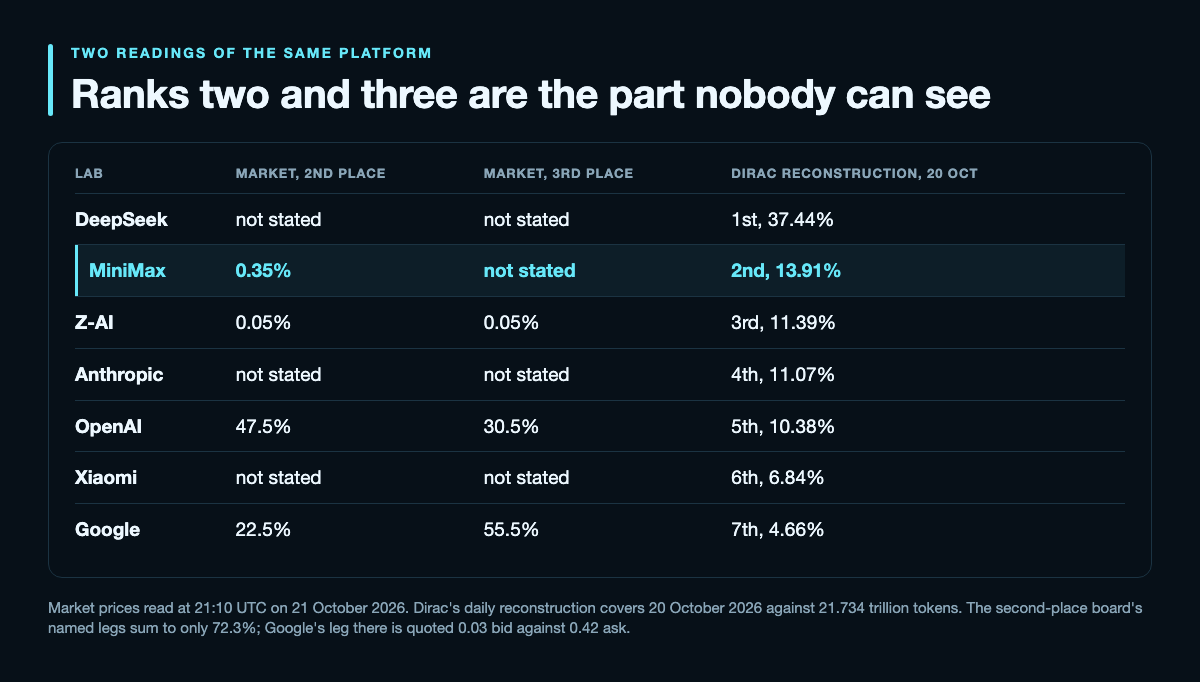
- Ranks two and three are the unresolvable part. The market prices OpenAI 47.5% and Google 22.5% for second place, yet a third-party daily reconstruction of the same platform for 20 October puts MiniMax second at 13.91% and Z-AI third at 11.39%, with Google seventh at 4.66%. The market quotes MiniMax at 0.35% for second.
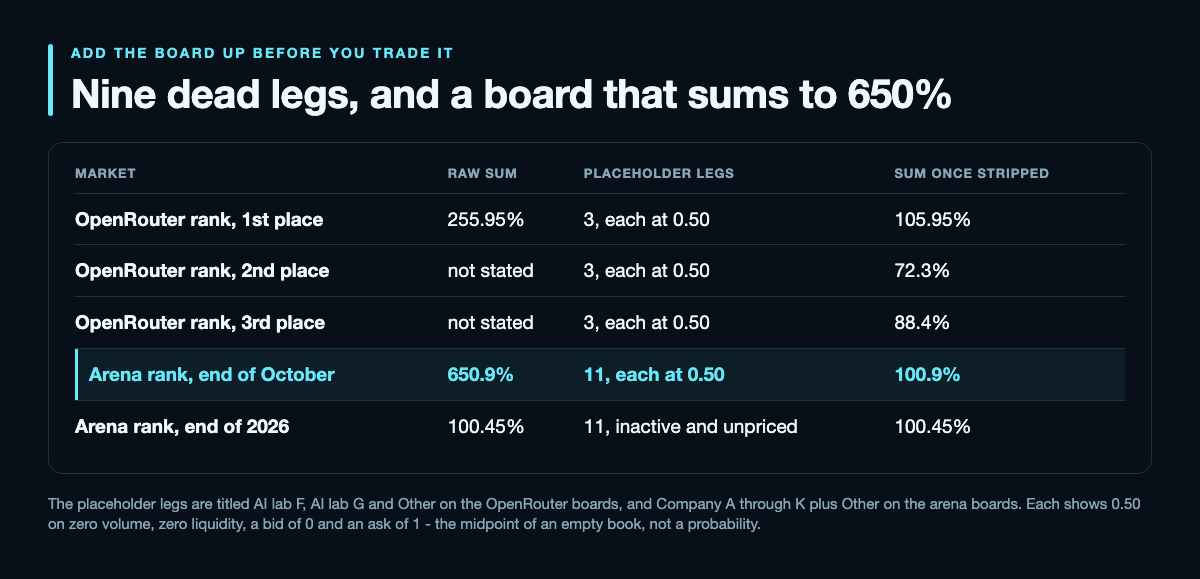
- Each rank market carries three extra legs named AI lab F, AI lab G and Other, quoted at 0.50 on zero volume and an empty book. Add them up naively and the first-place board sums to 256%. The end-of-October arena market has eleven of them and sums to 650%.
On this page
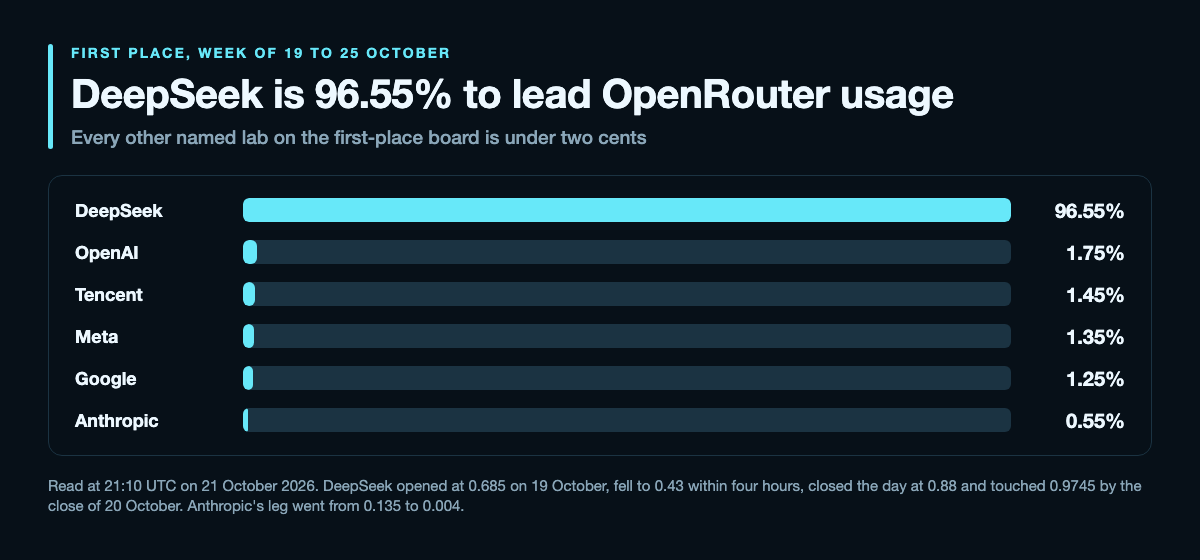
OpenRouter market share is now a tradable question, and the first week of prices says something the leaderboards do not. Polymarket opened three markets on 19 October 2026 asking which AI lab holds the first, second and third largest share of tokens routed through OpenRouter for the week of 19 to 25 October. DeepSeek is priced 96.55% for first. Anthropic is priced 0.55%, OpenAI 1.75%.
We read all five OpenRouter markets from the Polymarket Gamma API at 21:10 UTC on 21 October 2026, pulled every leg's hourly trade history from the CLOB, and set them beside the two much larger markets that rank the same labs by arena position. We also pulled the intelligence index OpenRouter publishes on the same page as the usage chart, so capability and usage come from one source rather than two.
Three things fell out of it. The lab the usage market has at 96.55% is ninth on the capability index. The second and third place markets price two labs that an independent daily reconstruction of the same platform ranks fifth and seventh. And every one of these boards carries dead legs quoted at 0.50 that make the naive probability sum nonsense.
The short version: the arena markets ask who built the best model, and the OpenRouter markets ask whose model is cheap enough to run in a loop. Not the same question, not the same answer, and only one of them has any money in it.
1. Four scoreboards for the AI race, four different leaders.
2. What the OpenRouter market share markets actually resolve on.
3. DeepSeek went from 68.5% to 96.5% in 62 hours.
4. Ranks two and three are the part nobody can see.
5. Why the usage board and the arena board disagree.
6. Nine dead legs and a board that sums to 650%.
7. The token usage markets price the platform's growth.
8. Five checks before you trade an OpenRouter market share market.
Four scoreboards for the AI race, four different leaders
Start with the disagreement, because it is why this corner of the board is worth reading. Four live rankings of the same industry were available on 21 October 2026, and no two put the same company on top.
Arena rank at the end of October: Google 80.75%, Anthropic 18.5%, OpenAI 0.55%, DeepSeek 0.05%. Lifetime volume $3,096,677 on a $1,575,422 book, and the week has moved hard, with Google up 12.35 points and Anthropic down 11.5. Arena rank at the end of 2026: Anthropic 48.5%, Google 41.5%, OpenAI 5.75%, DeepSeek 0.35%, on $2,750,090 of volume. So the same resolution mechanism, read ten weeks apart, flips the winner.
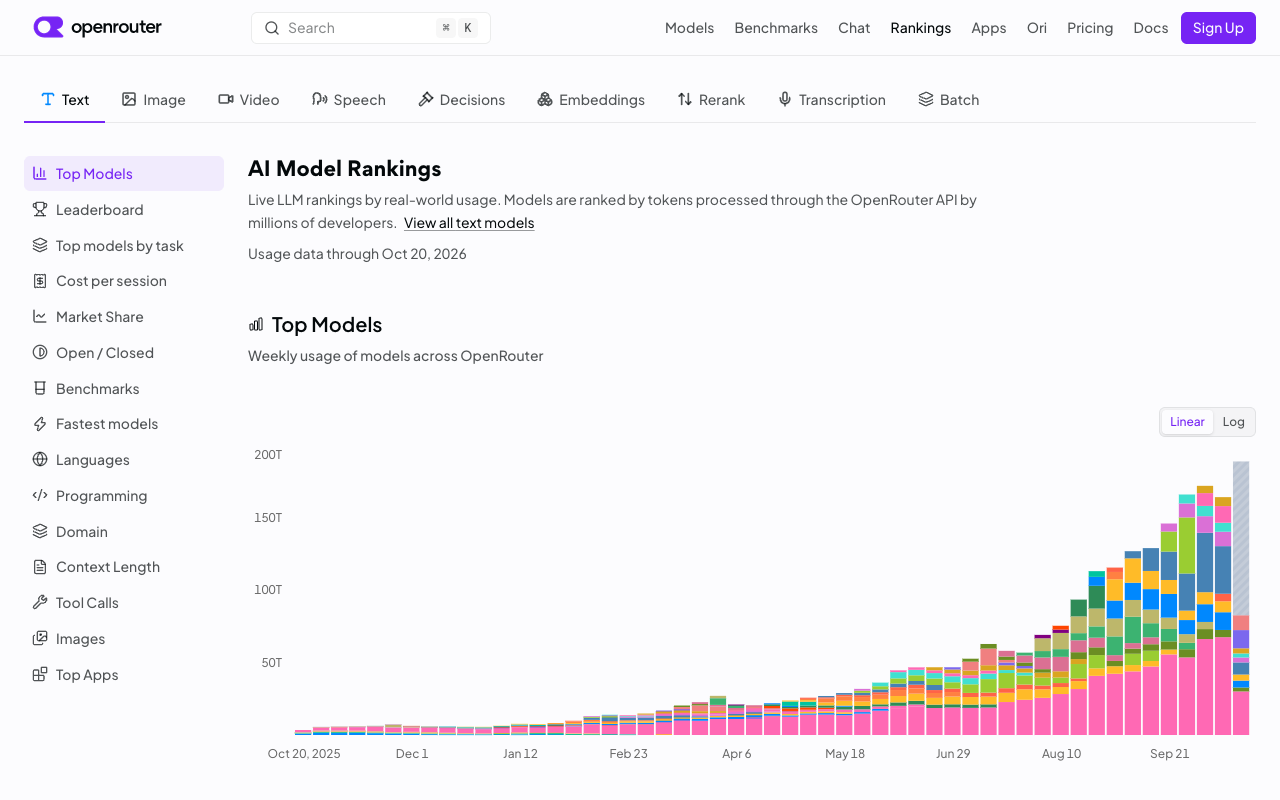
OpenRouter usage share for the week of 19 October: DeepSeek 96.55%, OpenAI 1.75%, Tencent 1.45%, Meta 1.35%, Google 1.25%, and Anthropic 0.55%. Lifetime volume $8,265. And the Artificial Analysis intelligence index, as published on OpenRouter's own rankings page with usage data through 20 October, tops out at GPT-5.6 Sol (Xhigh) on 78.3 and GPT-6 Astra (High) on 77.1, both OpenAI entries.
Four boards, four leaders: Google now, Anthropic by year end, DeepSeek on usage, OpenAI on capability. The money is not distributed anything like evenly across them. The two arena markets hold $5,846,767 of lifetime volume between them against $48,696 across the three OpenRouter rank markets, a ratio of 120 to 1, and $83,721 if you add the two token-volume markets alongside.
That asymmetry is the opportunity and the warning in one number. A market with $8,265 of turnover is not a consensus, it is a handful of traders, and every number below needs reading with that in mind.
What the OpenRouter market share markets actually resolve on
All three rank markets resolve off one chart. The text names the percentage displayed for a lab in OpenRouter's Market Share chart, set to Percentage, for the week of 19 to 25 October 2026. Resolution happens once the figures for the week of 26 October are first displayed, with a backstop of 11:59 PM ET on 30 October if that has not happened. The stealth and others groupings are explicitly not labs: if either occupies the relevant rank it is skipped and the next ranked lab is used.
That clause is doing more work than the prices are. The market does not resolve on tokens, requests or spend, or any figure you can reconstruct from an API. It resolves on a number rendered in one chart, in one display mode, for one week, with the platform's own lab grouping deciding who counts as a lab at all.
The two token-volume markets lean on a different chart on the same page: the sum of the weekly totals displayed in the Top Models chart on OpenRouter's AI Model Rankings page, for the four weeks beginning 28 September, 5 October, 12 October and 19 October. OpenRouter's weeks run Monday 00:00 UTC to Sunday 23:59 UTC, and the rules note that a week's figures keep updating until the following week's appear.
That is the clause that catches people: a figure you read on Friday is not the figure that resolves, because the current week is still filling in. The first of the two closes 26 October 2026 at 03:59 UTC.
Compare that with the arena markets, which name their source down to the URL. The end-of-October market reads the arena.ai Text Arena (Overall) leaderboard with style control off, filtered for Models, checked at 12:00 PM ET on 31 October, excluding anything marked AutoEval. The end-of-2026 market reads the Chatbot Arena leaderboard at lmarena.ai with style control off on 31 December. Same tournament, two addresses, two dates, two different favourites.
DeepSeek went from 68.5% to 96.5% in 62 hours
The first-place market opened at 07:00 UTC on 19 October, and its first day was not the lock it is now. DeepSeek printed 0.685 on the open, fell to 0.43 within four hours, and closed the day at 0.88. OpenAI, Google and Anthropic all opened within half a point of each other at 0.140, 0.140 and 0.135.
Then the first week's data started showing. By the close of 20 October DeepSeek had touched 0.9745 and the three American labs were at 0.016, 0.016 and 0.006. At our 21:10 UTC read on 21 October the leg sits at 0.9655, quoted 0.958 bid against 0.973 ask, on $4,820 of turnover in the DeepSeek leg alone.
The intraday prints on day one are worth keeping, because they are the only evidence of what the market thought before it could see anything. The OpenAI leg traded as high as 0.473 on 19 October and Google's as high as 0.503. Both are now below 2 cents. Anthropic's leg went from 0.135 to 0.004, which is a 97% fall in relative terms and the sharpest move on the board.
None of this contradicts the platform's own published history, which is why the convergence was so fast. OpenRouter's insight post on DeepSeek V4 adoption, published 30 June 2026 against 450 trillion tokens of request logs from 1 January to 14 June, tracks DeepSeek from just under 10% of weekly tokens in January, to roughly 5% in February and March, through the V4 release on 24 April, to the top model slot by mid-May and nearly 20% by early June.
A lab that doubled its share of a platform in six months and has held the top model slot since May is not a 68.5% favourite to lead a week, and three days of trading closed that gap. The interesting question was never first place.
Ranks two and three are the part nobody can see
Second place is priced OpenAI 47.5% and Google 22.5%, with everything else inside a point. Third place is priced Google 55.5% and OpenAI 30.5%. Both markets have been violent: on 21 October alone Google's second-place leg opened at 0.44 and closed at 0.225 while its third-place leg climbed from 0.465 to 0.555, and OpenAI's third-place leg fell from 0.42 to 0.31. The market swapped its view of which American lab lands where, inside one session.
Now set that against an independent reading of the same platform. Dirac's daily reconstruction of OpenRouter lab share for 20 October 2026, against 21.734 trillion tokens that day, ranks DeepSeek first at 37.44% and 8.136T, MiniMax second at 13.91% and 3.024T, Z-AI third at 11.39% and 2.476T, Anthropic fourth at 11.07%, OpenAI fifth at 10.38%, Xiaomi sixth at 6.84% and Google seventh at 4.66% on 1.013T.
First place agrees. Nothing else does. The market gives MiniMax 0.35% of holding second and Z-AI 0.05%, while pricing OpenAI and Google, fifth and seventh on that reading, at a combined 70% of the second-place slot. Z-AI's third-place leg opened at 0.23 on 19 October and was marked 0.0005 inside the first day.
Both cannot be right, and neither is checkable from outside. Dirac measures tokens per day; the market resolves on a weekly percentage in one chart, under OpenRouter's own lab grouping, with the stealth and others buckets removed. Daily against weekly, and one grouping against another, moves several labs several places.
The order book says traders know it. Google's second-place leg is quoted 0.03 bid against 0.42 ask, a 39 point spread on a market whose named legs sum to only 72.3%, which leaves 27.7 points of probability unaccounted for. That gap is not a mispricing to pick up. It is the market declining to quote a question it cannot see the answer to.
Why the usage board and the arena board disagree
The two boards are not in conflict. They are measuring different things, and once you see what each one rewards the gap stops being strange.
Take the intelligence index that OpenRouter publishes alongside the usage chart, with usage data through 20 October 2026. The top of it reads GPT-5.6 Sol (Xhigh) 78.3, GPT-6 Astra (High) 77.1, Muse Spark 1.3 (Xhigh) 76.5, GPT-5.4 (Xhigh) 71.1, KAT Coder Pro V2 59.5, Claude Fable 5.1 57.9, Claude Opus 5.5 57.6 and Claude Opus 5 56.5. DeepSeek's best entry, V4 Flash 0420 at 56.2, is ninth, 22.1 points below the top.
Ninth on capability, 96.55% to lead on usage. The explanation is in the price list rather than the benchmark. OpenRouter's own figures put DeepSeek V4 Flash at $0.09 per million input tokens and $0.18 output on its cheapest endpoint, against $5 and $30 for GPT-5.5. At that ratio a workload that burns tokens by the billion is not choosing on quality, and the platform says as much: agentic work drove most of DeepSeek's gain, agentic tokens passed human tokens around 1 February 2026, and V4 Flash was 70% of DeepSeek's agentic flow by the end of May.
The arena markets ask which single model wins a blind preference vote at one instant. A lab can win that with one expensive flagship serving a rounding error of traffic. The usage markets ask which lab's tokens actually moved, which rewards whichever model is cheap enough to leave running. Google at 80.75% on one board and 1.25% on the other is both of those facts at once, not a contradiction.
The practical consequence: a release that tops the arena is close to irrelevant to the usage board unless it also changes the rate card. The two boards respond to different news, which is why the arena markets moved on Google's week and the usage market did not.
Nine dead legs and a board that sums to 650%
Before reading any multi-outcome board on Polymarket, add it up. Each of the three OpenRouter rank markets carries twelve named labs plus three extra legs titled AI lab F, AI lab G and Other, each displaying 0.50 on zero volume, zero liquidity, a bid of 0 and an ask of 1. That 0.50 is not a probability. It is the midpoint of an empty book.
Add the first-place market naively and you get 255.95%. Strip the three dead legs and the twelve real ones sum to 105.95%, which is a sane 5.95 point overround for a market that has a near certainty in it. Second place sums to 72.3% and third to 88.4% once stripped, both well under 100, which is the unquoted-book problem from the previous section showing up as arithmetic.
The arena markets have the same pathology at larger scale, and they handle it two different ways. The end-of-October market carries eleven placeholder legs, Company A through K plus Other, all live and all quoting 0.50, so the raw sum is 650.9% against 100.9% across its twenty-one named legs. The end-of-2026 market has the same eleven placeholders, but they are marked inactive and carry no prices at all, so its fifteen named legs sum to 100.45% with nothing to strip.
Same event family, same template, one board quoting phantom coin flips and the other not. There is nothing to trade in it, and that is the point: any screen or script that sums outcome prices without checking volume and book depth is wrong by a factor of six on one of these markets and right on the other.
The token usage markets price the platform's growth
Alongside the rank markets sit two that ignore labs entirely and price how many tokens OpenRouter moves. The first covers the four weeks from 28 September to 25 October 2026 and carries $32,302 of lifetime volume on an $8,926 book. Its buckets now read: under 575T at 0.45%, 575 to 625T at 0.05%, 625 to 675T at 8%, 675 to 725T at 92%, and above 725T at 0.6%.
That 92% is three days old. The 675 to 725T leg opened at 0.44 on 5 October, closed 19 October at 0.335, closed 20 October at 0.68, opened 21 October at 0.73 and sits at 0.92 now. Its neighbour below, 625 to 675T, closed 19 October at 0.655 and is at 0.08. The two buckets swapped places inside 48 hours, which is what it looks like when the final week of a window comes in hotter than the market expected.
The tail tells the same story from the other side. Above 725T opened at 0.255 on 5 October and is now 0.6%, so the market has ruled out the high end while moving the centre up a bucket. With four days left in the window, this is close to a settled contract.
The next window is where the forecast lives. For 26 October to 22 November the board reads under 625T at 7%, 625 to 675T at 6.5%, 675 to 725T at 17.5%, 725 to 775T at 33.5% and above 775T at 26.5%. Sum the top two and the market gives 60% to the next four weeks landing above 725T, against a current window settling at 675 to 725T. That is a priced expectation of roughly 7% to 11% month-on-month growth in throughput, on $2,723 of volume and a $1,631 book, so treat it as a sketch. It is still the only place these numbers are quoted forward at all.
Five checks before you trade an OpenRouter market share market
First, strip the dead legs. Any leg with zero volume, zero liquidity and a 0 bid against a 1 ask is quoting its own emptiness at 0.50. Nine across the three rank markets, eleven more on the October arena market, and they are the difference between 106% and 256%.
Second, read the chart the market names, not the metric you prefer. A daily token count from anywhere else is evidence about the world, not about the contract, and for ranks two and three the two disagree completely.
Third, respect the spread. Google's second-place leg is 0.03 bid against 0.42 ask. A 39 point spread on an eight-day market means the mid is a decoration; you can only trade the ask, and the ask is often the whole edge.
Fourth, size to the book, not the volume. The three rank markets hold $42,898 of resting liquidity against $48,696 of lifetime turnover; the arena markets hold more than $2.9m. Any position you would need to exit before resolution belongs on the deeper board.
Fifth, do not read across boards. Topping the arena leaderboard tells you close to nothing about usage share, and the reverse holds: DeepSeek is 96.55% on usage and 0.05% on arena rank at the end of October. A thesis that needs both boards to agree needs a third piece of evidence neither contains.
Everything here is market data and context, not financial advice. Odsage is an independent information site and is not affiliated with Polymarket, OpenRouter, DeepSeek, OpenAI, Anthropic, Google or Artificial Analysis. Prices were read from the Polymarket Gamma API and the CLOB at 21:10 UTC on 21 October 2026 and the usage figures from OpenRouter's rankings page the same day; all of them will have moved since.
FAQ
Frequently asked questions
What are the OpenRouter market share odds on Polymarket?
Three markets opened on 19 October 2026 ranking AI labs by their share of tokens routed through OpenRouter for the week of 19 to 25 October. Read at 21:10 UTC on 21 October, first place prices DeepSeek at 96.55%, second place OpenAI at 47.5% and Google at 22.5%, and third place Google at 55.5% and OpenAI at 30.5%. All three close on 27 October 2026 on $48,696 of combined volume.
Why is DeepSeek priced so far ahead on usage but not on quality?
Because the two boards measure different things. DeepSeek V4 Flash costs $0.09 per million input tokens and $0.18 output on its cheapest OpenRouter endpoint, against $5 and $30 for GPT-5.5, and OpenRouter attributes most of DeepSeek's share gain to agentic workloads that burn tokens in volume. On the intelligence index published on the same page, DeepSeek's best entry is ninth at 56.2 against 78.3 at the top.
How does a market share market resolve?
On the percentage displayed for a lab in OpenRouter's Market Share chart, set to Percentage, for the stated week. Resolution triggers once the following week's figures are first displayed, with a backstop of 11:59 PM ET on 30 October 2026. The stealth and others groupings do not count as labs: if either holds the relevant rank it is skipped and the next ranked lab is used instead.
Why do the market prices disagree with third-party OpenRouter dashboards?
Measurement windows and lab grouping. Dirac's daily reconstruction for 20 October 2026 ranks MiniMax second at 13.91% and Z-AI third at 11.39%, with OpenAI fifth and Google seventh, while the market prices OpenAI and Google for second and third and gives MiniMax 0.35%. The market resolves on a weekly chart under OpenRouter's own grouping, not a daily token count, and only first place agrees.
Why do the outcome prices add up to more than 100%?
Dead legs. Each rank market carries three extra legs named AI lab F, AI lab G and Other at 0.50 on zero volume and an empty book, which is a midpoint of a 0 bid and a 1 ask rather than a probability. Strip them and the first place board sums to 105.95%. The end-of-October arena market carries eleven such legs and sums to 650.9% unstripped, against 100.9% across its named legs.
What do the OpenRouter token usage markets predict?
Platform throughput in four-week blocks. The 28 September to 25 October window is priced 92% in the 675 to 725 trillion token bucket, up from 33.5% at the close of 19 October. The 26 October to 22 November window gives a combined 60% to landing above 725T, which implies roughly 7% to 11% month-on-month growth, though on only $2,723 of volume.
Which board should I trust for who is winning AI?
Neither on its own. Four live boards named four different leaders on 21 October 2026: Google at 80.75% on arena rank for end of October, Anthropic at 48.5% for end of 2026, DeepSeek at 96.55% on OpenRouter usage, and OpenAI on top of the intelligence index. Pick the board that matches your question, and note that 120 times more money sits on the arena pair.
Sources and methodology
Sources used for this guide
Odsage combines public source links with prediction-market context, related market pages, calculator workflows, and visible FAQ content. Market prices are informational and are not financial advice.