AI Releases
AI Model Release Odds 2026: One Ladder in Six Adds Up
AI model release odds sit in ten live Polymarket markets. We measured all six date ladders: only one brackets to the $1.00 its structure requires.
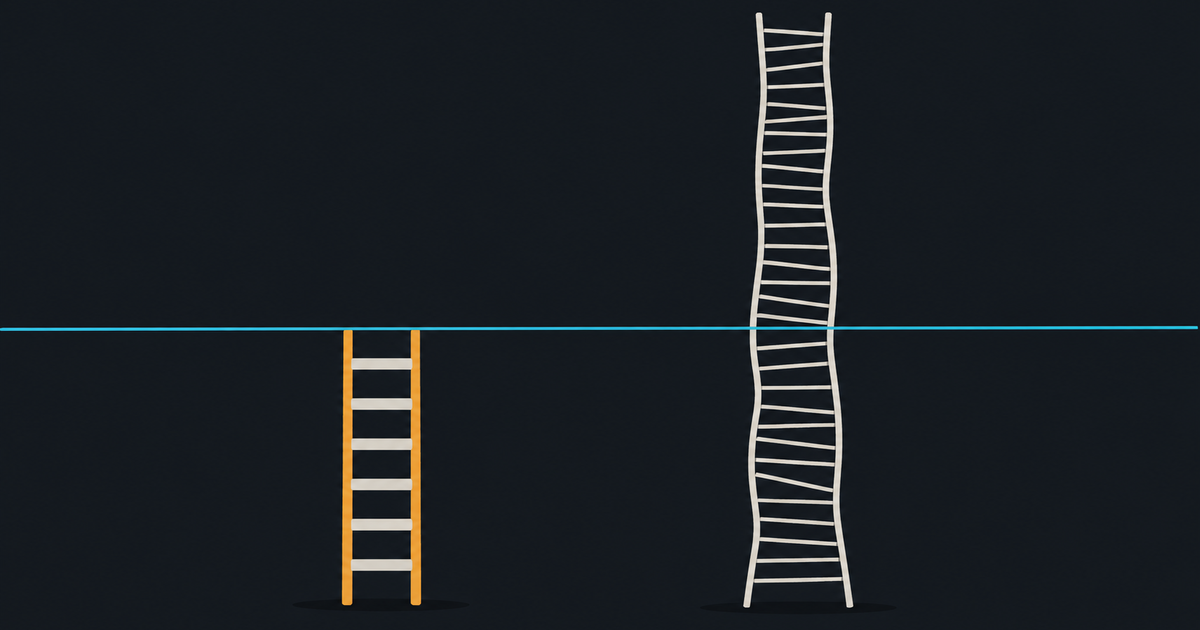
Key takeaways
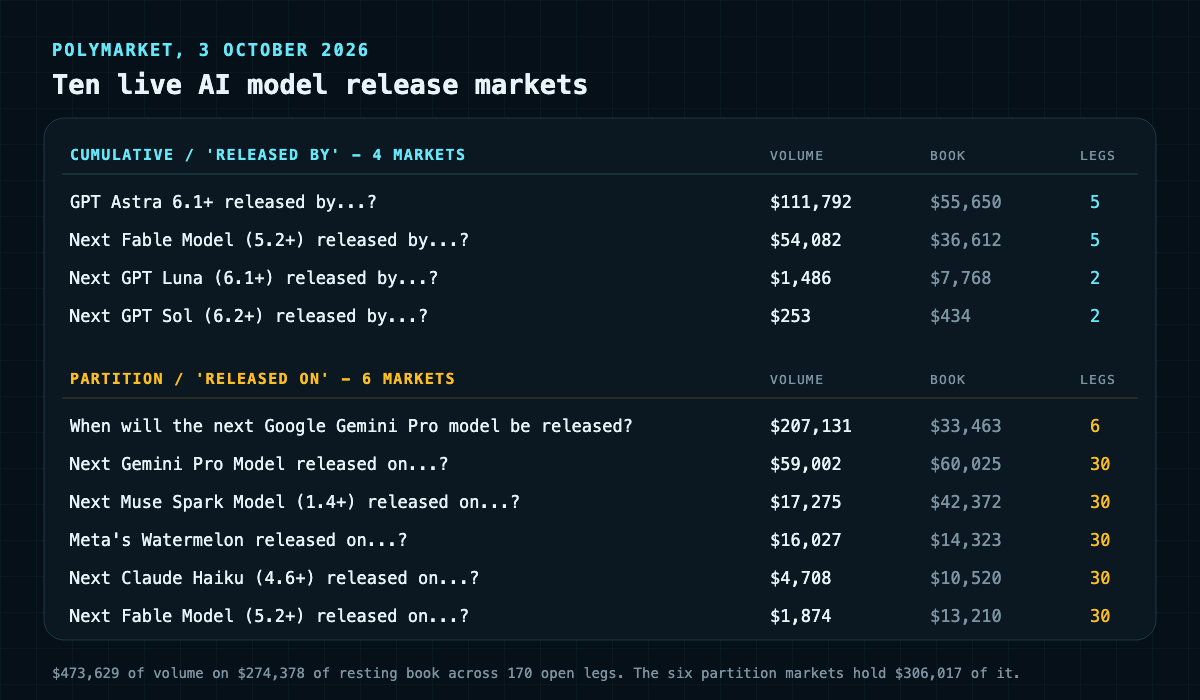
- Ten live Polymarket events price when the next frontier model ships: $473,629 of volume across 170 open legs on $274,378 of resting book. Six are mutually exclusive date ladders, which Polymarket's negative-risk structure says must price to about $1.00.
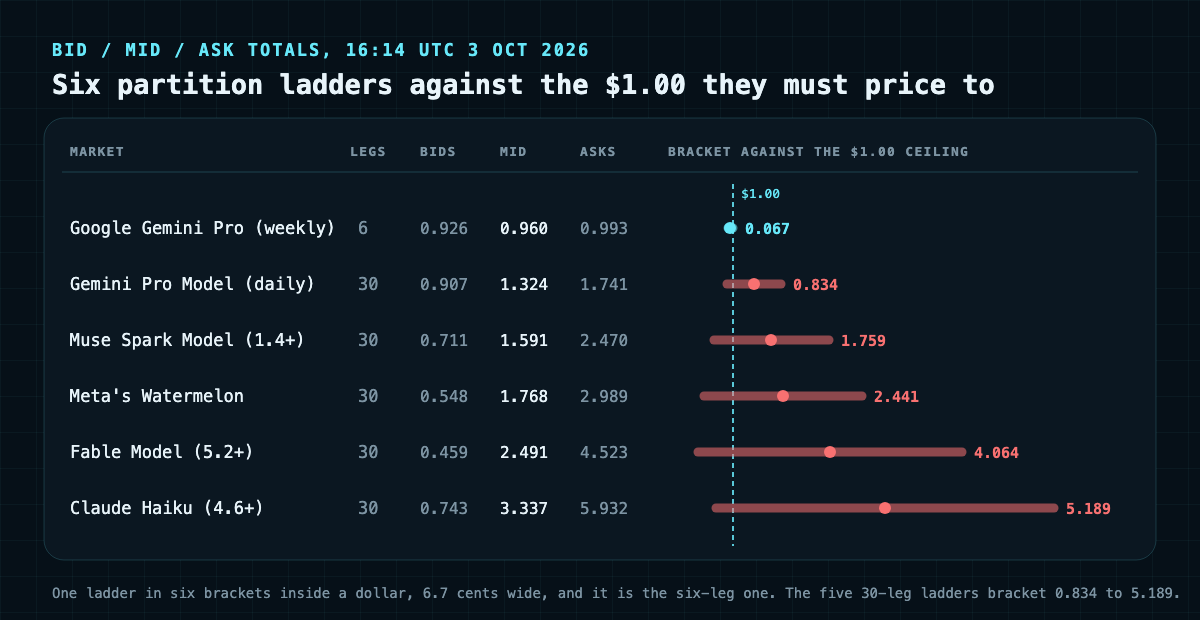
- Only one of the six does. The six-leg weekly ladder on the next Gemini Pro model brackets from 0.926 at the bids to 0.993 at the asks: a 6.7-cent window, entirely below $1.00. The five 30-leg daily ladders bracket 0.83, 1.76, 2.44, 4.06 and 5.19 wide.
- The worst is Next Claude Haiku (4.6+) released on...?, whose 30 legs sum to 0.743 at the bids and 5.932 at the asks. Its midpoints total 3.337, implying the model ships on 3.3 separate days. Not an arbitrage but a measurement failure: nobody can sell the set for over $1.00 either.
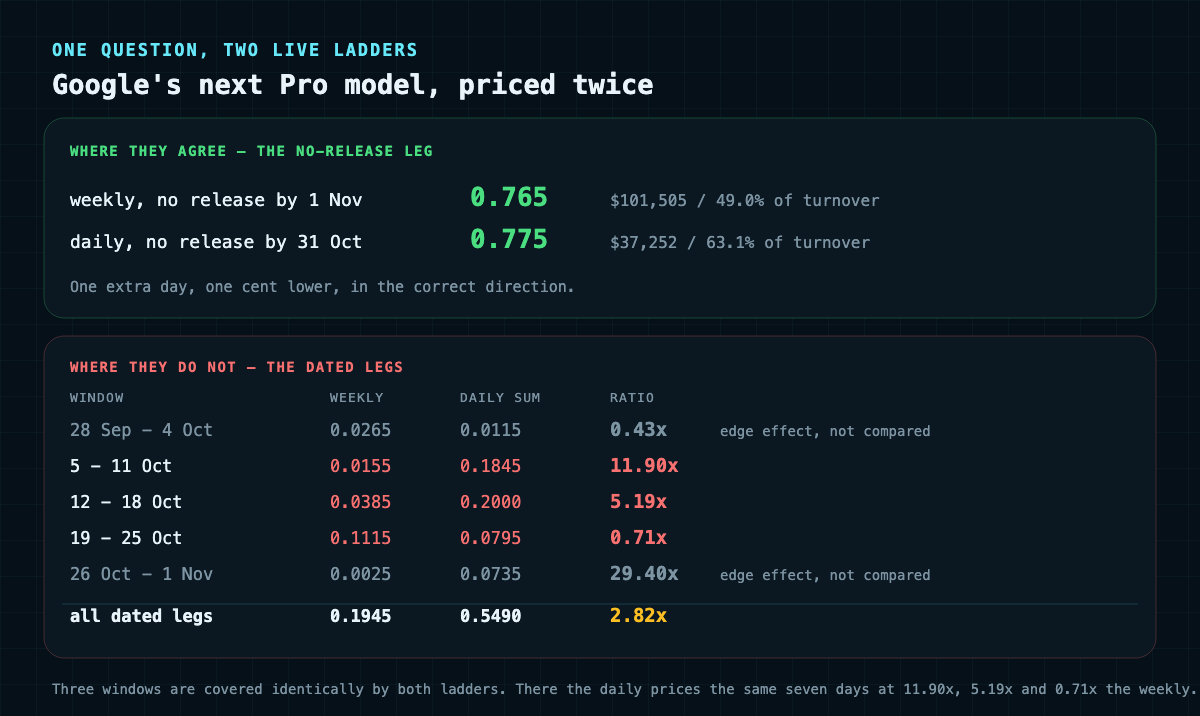
- Google's next Pro model is priced in two live markets at once. Their deep legs agree to a cent, 76.5% and 77.5% for no release. Their dated legs disagree by 2.82x, and in the three windows both ladders cover identically the daily legs price 11.90x, 5.19x and 0.71x the weekly bucket.
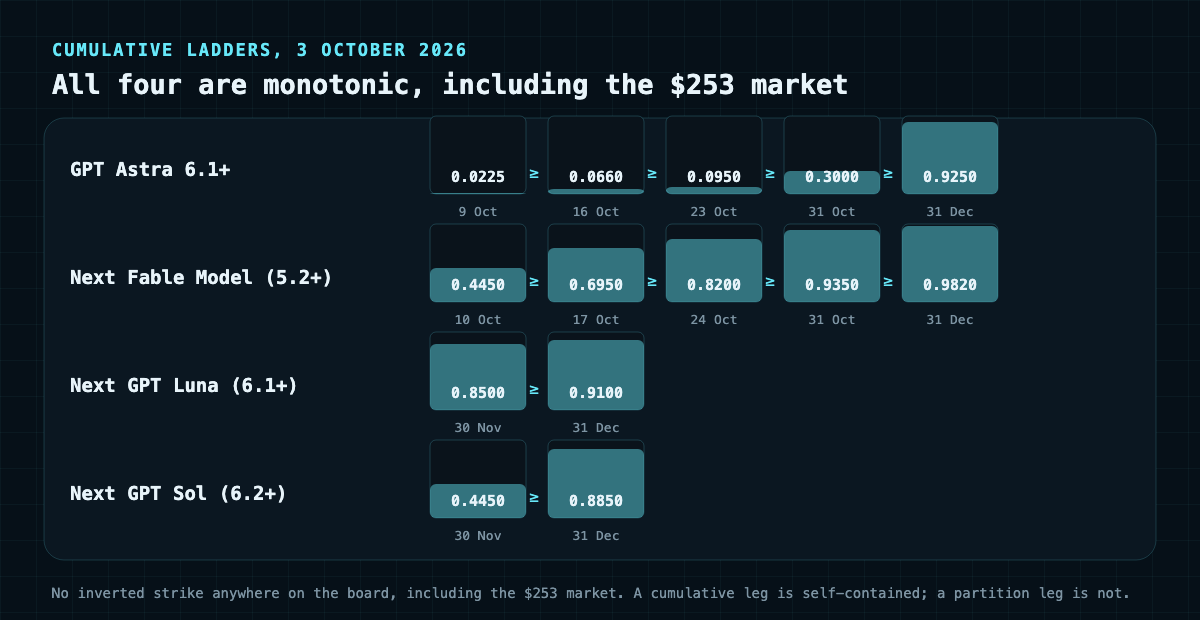
- All four cumulative 'released by' ladders are perfectly monotonic, no inverted strike anywhere, including a $253 market. Cumulative ladders survive a thin book; partition ladders do not.
On this page
AI model release odds are the easiest number on Polymarket to quote and the hardest to read, because most of the markets producing them are arithmetically broken and look identical to the ones that are not. Ten live events price when the next frontier model ships: $473,629 of volume and $274,378 of resting orders across 170 open legs. Six are date ladders whose prices, under the structure Polymarket deploys them in, must add up to about a dollar.
We added them up. One of the six does. The other five bracket between 83 cents and $5.19 wide, so the honest answer to "what are the odds" on those markets is a range too broad to carry information.
The date ladder is where every release headline comes from. A 7% leg on a Tuesday in October reads like a forecast, gets screenshotted, and is really the midpoint between a bid nobody will raise and an ask nobody will pay.
Every figure below was read from the Polymarket Gamma API at 16:14 UTC on 3 October 2026, quoted with its bid and ask rather than the midpoint alone, and every ladder summed three ways from the raw book. On these markets that is the difference between a number and a guess.
1. The ten live markets, and what each one asks.
2. Two shapes of release contract, and why conflating them costs money.
3. What a date ladder has to add up to, and who enforces it.
4. The ladder bracket: six partition sets measured side by side.
5. Google's next Pro model, priced twice, with a 29x disagreement.
6. Why all four cumulative ladders stayed honest.
7. The Fable 5.2 pair and the four-hour seam between them.
8. Five checks to run before you trade any of this.
The ten live AI model release markets
Polymarket's release board on 3 October 2026 holds ten open events across six labs. Four ask whether a model is out by a deadline. Six ask which day it lands on. The split is not cosmetic.
The four cumulative markets, largest first: GPT Astra 6.1+ released by...? at $111,792 of volume and $55,650 of book, five deadlines from 9 October to 31 December. Next Fable Model (5.2+) released by...? at $54,082 and $36,612, five deadlines from 10 October to 31 December. Next GPT Luna (6.1+) released by...? at $1,486 and $7,768, two deadlines. Next GPT Sol (6.2+) released by...? at $253 and $434, two deadlines, and the smallest market on the board by a factor of six.
The six date-partition markets, largest first: When will the next Google Gemini Pro model be released? at $207,131 and $33,463, six legs covering five weekly windows plus a no-release leg. Next Gemini Pro Model released on...? at $59,002 and $60,025, thirty legs. Next Muse Spark Model (1.4+) released on...? at $17,275 and $42,372, thirty legs. Meta's Watermelon released on...? at $16,027 and $14,323, thirty legs. Next Claude Haiku (4.6+) released on...? at $4,708 and $10,520, thirty legs. Next Fable Model (5.2+) released on...? at $1,874 and $13,210, thirty legs.
Two things before any price is quoted. The partition markets hold $306,017 of the $473,629 total, so most of the money sits in the shape that turns out unreliable. And five of the six carve one month into twenty-nine days plus a no-release leg, spreading a market's attention across thirty books instead of six.
Two shapes of release contract, and only one forgives a thin book
A "released by" ladder is cumulative. Each leg is its own yes-or-no bet on a deadline, the legs overlap by design, and a model shipping on 12 October resolves YES on every deadline from 17 October onward. Nothing requires the legs to sum to anything. The one constraint is that they must never fall as the dates go out: the probability of shipping by a later date cannot be lower than by an earlier one.
A "released on" ladder is a partition. The legs are mutually exclusive and jointly exhaustive: exactly one of the thirty resolves YES and twenty-nine resolve NO. Stronger structure, stronger constraint — the prices have to sum to the payout, which is one dollar.
The practical difference is what a thin book does to each. A five-leg cumulative ladder has five books, each independently meaningful, so a trader with a view only on "out before Halloween" expresses it in one place. The ordering is cheap to police: one pass down the strikes.
A thirty-leg partition needs thirty books kept mutually consistent, and almost nobody holds a day-level view on a release. So the legs nobody cares about are not priced at zero, they are left unpriced: a one-cent bid, a forty-cent ask, a midpoint no human chose. Thirty of those, and the sum is whatever the makers' default spreads produce.
Both shapes publish a percentage that looks exactly like the other. The next two sections tell them apart from outside.
What a date ladder has to add up to
Polymarket links a mutually exclusive outcome set as a negative-risk group, and its developer docs are explicit about the price consequence: in a negative-risk set of N outcomes, the sum of all YES prices should be about $1.00. The mechanism is the Neg Risk Adapter, which lets a NO share in any one market convert into one YES share in every other market in the set.
That conversion normally keeps the arithmetic honest, and it is why the errors run one way. The adapter supports the NO side: a trader who finds the NO legs collectively too cheap has a protocol-level primitive for collecting the difference. A trader who finds the YES legs too expensive has no equivalent tool, only the work of selling thirty legs into thirty books.
This is not our observation. Gebele, Mutzel and Matthes measured executable arbitrage across Polymarket's negative-risk markets in a paper submitted on 1 August 2026, reconstructed roughly $1.12 million of realised arbitrage profit, and found positive payoff-bound violations concentrate on the unsupported YES side, while adapter-supported NO-side violations are rarer and shorter-lived. Efficiency, they conclude, depends on whether a protocol exposes a payoff equivalence as an executable primitive, not merely on whether the structure implies one.
A thirty-leg release ladder is that argument in miniature. The structure says the YES prices sum to a dollar, the adapter does not make that side executable, so the YES side drifts — and the number it drifts to is the one everybody quotes.
Which gives a test anyone can run in a minute. Add the legs up, and not the midpoints alone, which is the mistake. Add the bids, add the asks, and see how far apart the totals sit.
The ladder bracket: six partition sets measured
Every date-partition market, legs summed three ways from the raw book at 16:14 UTC on 3 October 2026. The bracket is the gap between the bid-side and ask-side totals: the window the true value sits inside. A sound ladder brackets a hair below $1.00, a cent or two wide.
When will the next Google Gemini Pro model be released? Six legs. Bids 0.926, midpoints 0.960, asks 0.993. Bracket 0.067. Volume $207,131.
Next Gemini Pro Model released on...? Thirty legs. Bids 0.907, midpoints 1.324, asks 1.741. Bracket 0.834. Volume $59,002.
Next Muse Spark Model (1.4+) released on...? Thirty legs. Bids 0.711, midpoints 1.591, asks 2.470. Bracket 1.759. Volume $17,275.
Meta's Watermelon released on...? Thirty legs. Bids 0.548, midpoints 1.768, asks 2.989. Bracket 2.441. Volume $16,027.
Next Fable Model (5.2+) released on...? Thirty legs. Bids 0.459, midpoints 2.491, asks 4.523. Bracket 4.064. Volume $1,874.
Next Claude Haiku (4.6+) released on...? Thirty legs. Bids 0.743, midpoints 3.337, asks 5.932. Bracket 5.189. Volume $4,708.
One ladder in six brackets inside a dollar, and it is the six-leg one: its whole bid-to-ask window sits below the $1.00 ceiling, 6.7 cents wide. The five thirty-leg ladders bracket from 83 cents to $5.19, Claude Haiku worst — midpoints totalling 3.337, read literally the model ships on 3.3 different days.
The temptation is to call that free money, and it is worth being precise about why it is not. You cannot sell the Haiku set for 3.337: selling every leg into its bid collects 0.743, less than the dollar you would owe. The 3.337 is untradeable, the average of thirty bids nobody will raise and thirty asks nobody will pay.
The spreads are the mechanism. On Haiku, 8 October shows a 0.01 bid against a 0.458 ask, 191% of its own midpoint. Watermelon prices 5 October at 0.003 bid and 0.485 ask, 198% of the 0.244 midpoint a screenshot reports as "24%". Each midpoint is an artefact of that gap, not a view about the date.
Depth explains which ladders hold. Median dated-leg volume is $16,100 in the weekly Gemini market, $522 in the daily one, $106 on Watermelon, $20 on Fable's. The ladders surviving their own arithmetic have fewer, deeper legs, and across all six that relationship is monotonic.
Google's next Pro model, priced twice, 29x apart
The strongest evidence is that one release question is live in two markets at once, so the ladders can be read against each other rather than against a theory. Google's next Gemini Pro model has a six-leg weekly ladder and a thirty-leg daily ladder running at once, on the same event and resolution subject.
Start with where they agree. The weekly no-release leg, covering no release by 1 November, prices at 0.765; the daily one, no release by 31 October, at 0.775. One extra day, one cent lower, in the correct direction. Those legs carry $101,505 and $37,252, or 49.0% and 63.1% of their market's turnover. Where the money is, the two ladders are the same market.
Now the dated legs: weekly bucket against the sum of the same calendar days in the daily ladder.
28 September to 4 October: weekly 0.0265, daily-sum 0.0115, ratio 0.43x. Not comparable, and we flag it rather than use it — the daily ladder opened on 3 October, covering two of those seven days.
5 to 11 October: weekly 0.0155, daily-sum 0.1845, ratio 11.90x.
12 to 18 October: weekly 0.0385, daily-sum 0.2000, ratio 5.19x.
19 to 25 October: weekly 0.1115, daily-sum 0.0795, ratio 0.71x.
26 October to 1 November: weekly 0.0025, daily-sum 0.0735, ratio 29.40x. Six of seven days overlap; 1 November falls outside the daily ladder.
All dated legs together: weekly 0.1945, daily-sum 0.5490, ratio 2.82x.
Three windows — 5 to 11, 12 to 18 and 19 to 25 October — are covered identically by both ladders, with no edge effects to argue about. There the daily ladder prices the same seven days at 11.90x, 5.19x and 0.71x the weekly figure. The disagreement has no consistent direction, the signature of noise rather than a differing view: a merely more bullish ladder would be high in all three.
So the two agree on the question people have opinions about, whether Google ships this month, and disagree by up to an order of magnitude on the one nobody does, which Tuesday. Both publish percentages; only one set means anything, and from outside they look identical.
Why all four cumulative ladders stayed honest
If thin books broke the partition ladders, the cumulative ones should be worse, because two are tiny. They are not. All four are perfectly monotonic, with no inverted deadline anywhere on the board.
GPT Astra 6.1+: 9 October 0.0225, 16 October 0.0660, 23 October 0.0950, 31 October 0.3000, 31 December 0.9250.
Next Fable Model (5.2+): 10 October 0.4450, 17 October 0.6950, 24 October 0.8200, 31 October 0.9350, 31 December 0.9820.
Next GPT Luna (6.1+): 30 November 0.8500, 31 December 0.9100.
Next GPT Sol (6.2+): 30 November 0.4450, 31 December 0.8850. This is the $253 market, and it is ordered correctly too.
The two five-leg ladders read as coherent forecasts rather than price noise, which differencing shows. Astra implies 30.0% by Halloween and 92.5% by year end, so 62.5 points of probability sit in November and December alone: a market expecting the model, late. Fable implies 93.5% by Halloween and 98.2% by year end, leaving 4.7 points for two months: a market expecting it within weeks.
The shape holds up because a cumulative leg is self-contained. It needs no agreement with its neighbours, so a trader with one view prices one deadline and walks away, and the only cross-leg discipline is an ordering anyone can check in a pass. A partition leg means nothing except relative to the other twenty-nine, which is a coordination problem rather than a forecasting one.
The practical consequence is the most useful line here. When both shapes exist for the same model, read the cumulative ladder and treat the daily one as decoration. When only a daily ladder exists, read its no-release leg and ignore the dates.
The Fable 5.2 pair and its four-hour seam
Fable 5.2 is the one model with both shapes live, so it is where two ladders square against each other directly. They nearly square, and the gap is instructive.
The cumulative market's 31 October leg bids 0.93 and asks 0.94 on $11,368 of book. The daily market's no-release-by-31-October leg bids 0.076 and asks 0.116 on $1,979. Same event from opposite sides: either Fable 5.2 is out by the end of October or it is not, so exactly one resolves YES.
Short both and you collect 0.93 plus 0.076, which is 1.006, against a one-dollar liability falling due exactly once — a six-tenths-of-a-cent credit that cannot lose on the stated terms. Buying both instead costs 1.056, so the error is strictly on the sell side, which is the unsupported YES side again.
Six-tenths of a cent on a dollar of notional is not a trade for most readers; gas, capital tied up to 31 December, and holding two positions in two events will eat it. Its value is as a measurement: on the board's deepest pair of legs, two markets on one question are 0.6% out of line and nobody has closed it. That is the ceiling of efficiency here, not the floor.
There is also a seam in the dates. Gamma records the cumulative leg ending 23:59 UTC on 31 October and the daily no-release leg at 03:59 UTC on 1 November, which is 23:59 Eastern on 31 October. Four hours of that evening fall inside one contract and outside the other, so on the stated terms a release there pays both short legs — a bonus rather than a risk. We would not lean on it: an endDate field is API metadata, and the rules text resolves a market. Read both rules pages first.
Five checks before you trade AI model release odds
None of this needs a script or a subscription. Five minutes per market, and on the evidence above it changes which number you believe.
One: identify the shape before the price. "Released by" is cumulative and each leg stands alone. "Released on" or "When will" is a partition, where no leg means anything by itself. Both publish identical-looking percentages and nothing in the interface flags the difference.
Two: on any partition ladder, add the legs up three times — bids, midpoints, asks. If the bid and ask totals sit more than a few cents apart you have measured the ladder's precision, and it is poor. Five of six here bracket wider than 83 cents, and the midpoints inside them are not probabilities.
Three: read the no-release leg and nothing else. On all six partition markets it is the deepest leg, carrying up to 63.1% of turnover, and on the model priced twice the two no-release legs agreed within a cent while the dated legs were 2.82x apart. One minus that leg is the only release probability on a daily ladder worth quoting.
Four: check a cumulative ladder for ordering, then difference it. Monotonicity takes one pass down the strikes. Differencing adjacent legs turns it into a month-by-month forecast, where the view lives: 62.5 points of Astra's probability in November and December says far more than its 30.0% by Halloween.
Five: size to the book and timestamp the quote. $473,629 of lifetime volume sits on $274,378 of resting orders, and the thin legs are thin by three orders of magnitude, median dated-leg volume running $16,100 down to $20. A quote without the hour it was read is unusable on markets that move several points on a few thousand dollars.
The uncomfortable summary is that the broken ladders are not badly written contracts. The rules text on the Claude Haiku market is fine; it is the thirty-way split no retail board has the attention to price. Read the shape, then the depth, then the number. Market prices here are informational and nothing on this page is financial advice.
FAQ
Frequently asked questions
What are AI model release odds on Polymarket right now?
Read at 16:14 UTC on 3 October 2026, ten live events price frontier model releases with $473,629 of volume across 170 legs. GPT Astra 6.1+ prices 30.0% by 31 October and 92.5% by 31 December. Fable 5.2 prices 93.5% and 98.2%. The next Gemini Pro model prices 23.5% by 1 November. GPT Luna 6.1+ prices 91.0% by 31 December, GPT Sol 6.2+ 88.5%.
What is the difference between a 'released by' and a 'released on' market?
A 'released by' ladder is cumulative: each leg is an independent bet on a deadline, legs overlap, and the only constraint is that prices cannot fall as the dates go out. A 'released on' ladder is a mutually exclusive partition where exactly one leg resolves YES, so prices must sum to about $1.00. Cumulative ladders stay coherent on thin books; partition ladders do not.
Why do the legs of a Polymarket date ladder not add up to 100%?
Because the midpoints are not prices anyone is trading. On a thirty-leg ladder most legs have no interested buyer or seller, so they sit at a one-cent bid against a wide ask with the midpoint halfway between. Polymarket's negative-risk docs say a mutually exclusive set should sum to about $1.00, and the adapter enforcing it supports the NO side, not the YES side, so YES totals drift upward unchecked.
Which AI model release ladder is priced most accurately?
The six-leg weekly market on the next Google Gemini Pro model. Its legs total 0.926 at the bids and 0.993 at the asks, a 6.7-cent bracket entirely below the $1.00 ceiling, on $207,131 of volume with median dated-leg volume of $16,100. It is the only one of the six whose arithmetic holds.
Can you arbitrage a date ladder that sums to more than $1.00?
Usually not, and the Claude Haiku ladder shows why. Its midpoints total 3.337, but selling every leg into its own bid collects only 0.743 against a dollar of liability. The overpricing exists only at midpoints, which are untradeable. A real arbitrage needs the bid-side total above 1.00 or the ask-side total below it, and neither holds on these six.
Do two Polymarket markets on the same AI model release ever disagree?
Yes, and by a lot. Google's next Pro model runs a weekly and a daily ladder at once. In the three windows both cover identically, the daily legs price the same seven days at 11.90x, 5.19x and 0.71x the weekly bucket. On Fable 5.2, the cumulative 31 October leg at 0.93 and the daily no-release leg at 0.076 sum to 1.006, a 0.6-cent inconsistency on the board's deepest pair.
Sources and methodology
Sources used for this guide
Odsage combines public source links with prediction-market context, related market pages, calculator workflows, and visible FAQ content. Market prices are informational and are not financial advice.